
Data Silos Are Costing You More Than You Think
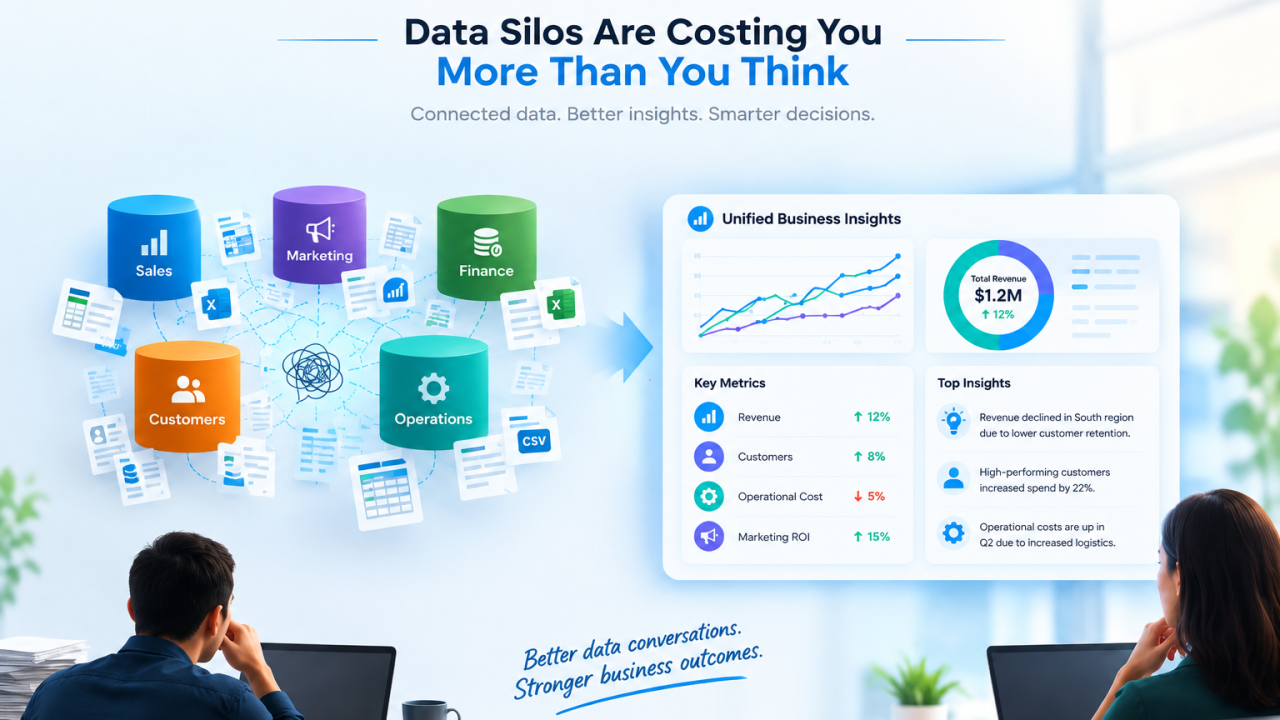
Every business has data. Sales data. Customer data. Marketing data. Finance data. Operations data.
The challenge is rarely whether data exists. The real challenge is how effectively that data can be accessed, connected, understood, and used to make decisions.
In many organizations, valuable information is scattered across different systems, departments, spreadsheets, databases, and applications. Each team may have the data it needs, but the complete picture is often difficult to see.
And when leaders need answers, that is where the real cost of disconnected data begins.
When a simple question becomes a complicated process
Consider a question that sounds straightforward:
“Why did our revenue drop last month, and what should we do about it?”
Ideally, the answer should be available quickly enough to support a decision. But in a data-siloed organization, answering that question can involve multiple teams and systems.
- Sales data may live in a CRM.
- Customer information may exist in another platform.
- Marketing performance may be stored in an analytics tool.
- Financial information may sit inside an ERP or accounting system.
- Operational data may be maintained somewhere else entirely.
Someone has to collect the information. Someone has to clean it. Someone has to reconcile different numbers. Someone has to prepare a report.
Then the questions begin again. Why did revenue decline? Which region was affected? Which customers contributed to the change? Did marketing performance change? Did operational costs increase?
What started as one business question can quickly become a chain of reports, meetings, spreadsheets, and follow-up requests. While teams are searching for the answer, the business is still making decisions.
The hidden cost of disconnected data
The cost of data silos is not limited to infrastructure, storage, or software licenses. There is another cost that is much harder to measure:
The distance between a business question and an informed decision.
When information is fragmented, teams spend valuable time finding and preparing data instead of using it.
- Analysts may spend hours combining datasets.
- Managers may compare multiple versions of the same metric.
- Executives may wait for reports before acting.
- Different departments may even interpret the same business metric differently.
Over time, this creates friction across the organization. The problem is not necessarily a lack of data. It is the lack of connected context around that data.
A dashboard does not solve everything
Dashboards are valuable. They help organizations monitor KPIs, track performance, identify trends, and understand what is happening across the business.
But dashboards primarily answer questions that have already been anticipated. They might tell you:
- Revenue decreased by 8%.
- Customer churn increased.
- Marketing conversions declined.
- Operating costs increased.
But the next question is usually more important: Why?
A business user may ask, “Why did sales decline in one region?” Then, “Which customers contributed most to the decline?” Then, “Did those customers reduce their purchases because of pricing, competition, or another factor?” And then, “What happened to marketing activity in that region?”
The further you investigate, the more likely you are to need information from multiple sources. This is where traditional reporting workflows can become slow and dependent on technical teams.
Having data available is not the same as having insight available.
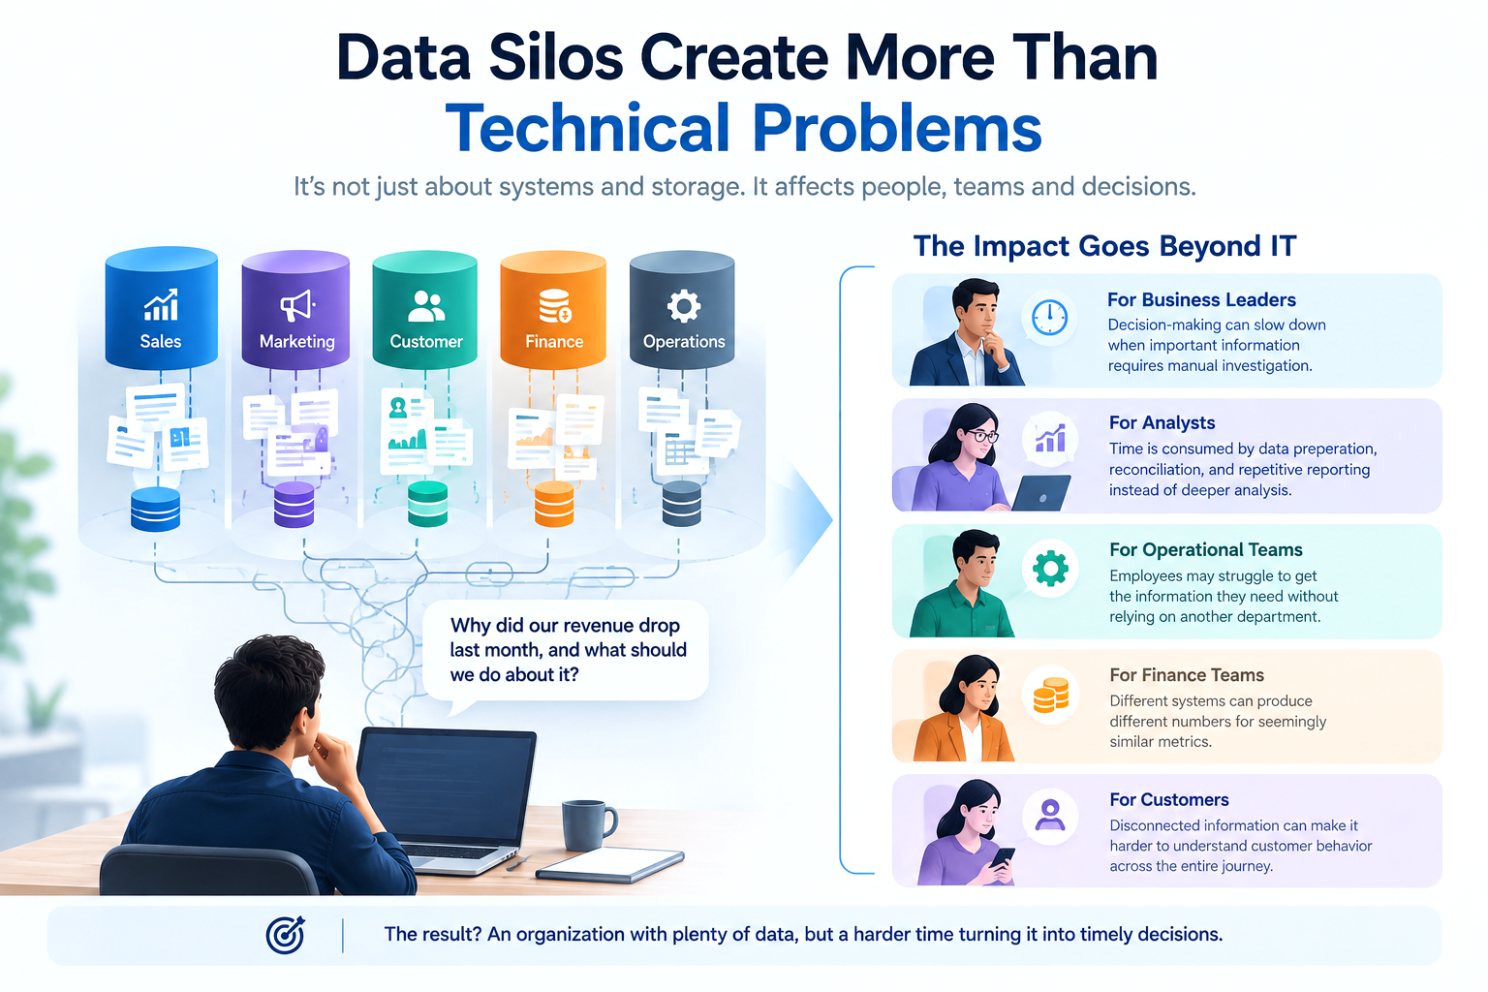
Data silos create more than technical problems
Data silos are often treated as an IT problem. But their impact extends far beyond technology.
- For business leaders: decision-making can slow down when important information requires manual investigation.
- For analysts: time can be consumed by data preparation, reconciliation, and repetitive reporting instead of deeper analysis.
- For operational teams: employees may struggle to get the information they need without relying on another department.
- For finance teams: different systems can produce different numbers for seemingly similar metrics.
- For customers: disconnected information can make it harder to understand customer behavior across the entire journey.
The result is an organization that has plenty of data but may struggle to turn that data into timely decisions.
So, how can businesses tackle data silos?
The solution is not simply to collect more data. Most organizations already have a significant amount of information. The opportunity is to make the existing data more useful.
1. Connect data across departments
Sales, marketing, finance, customer service, and operations should not always be viewed as isolated sources of information. Connecting relevant data sources can help organizations understand relationships that are invisible when each dataset is viewed independently.
For example, declining sales might make more sense when viewed alongside customer activity, marketing campaigns, pricing changes, inventory levels, or regional performance.
The objective is not to connect everything indiscriminately. It is to connect the data needed to answer meaningful business questions.
2. Build trust in the numbers
Connecting data is only part of the problem. Teams also need to trust the information they are using. Organizations should establish:
- Consistent metric definitions
- Reliable data sources
- Clear ownership of important datasets
- Appropriate data governance
- Transparent calculation logic
- Regular data-quality checks
If one department defines “active customer” differently from another, even a technically connected system can produce confusing results. Connected data without trusted definitions can still lead to disconnected decisions.
3. Make data accessible
Data should not be accessible only to people who know SQL, understand database structures, or can navigate complex analytics platforms.
Business users often think in questions, not database schemas. They ask:
- “What were our top-performing products last quarter?”
- “Which customers reduced their spending?”
- “Which region has the highest operational cost?”
The closer organizations can get to answering questions in business language, the easier it becomes for more people to work with data.
This does not mean removing analysts or data professionals from the process. Instead, it can allow technical teams to spend more time on complex analysis while business teams handle everyday questions independently.
4. Turn insights into action
Insight has limited value if it never influences a decision.
Finding that customer churn increased is useful. Understanding why it increased is more useful. Identifying which customers are at risk is even more actionable. And connecting that insight to an appropriate business response is where data can create operational value.
The goal should therefore move beyond Data → Report toward:
Data → Insight → Decision → Action
That shift can fundamentally change how organizations think about analytics.
5. Start with the questions that matter
Organizations do not necessarily need to solve every data problem at once. A practical starting point is to identify the questions that consume the most time. Ask:
- Which business questions repeatedly require manual reporting?
- Where does the required data come from?
- How many systems are involved?
- How long does it take to get an answer?
- Who needs to be involved?
- What decision is waiting for that answer?
These questions can reveal where data fragmentation is creating the most friction. Instead of starting with technology, start with the business question.
From data collection to data conversation
For years, organizations have invested in collecting, storing, processing, and visualizing data. But the next challenge is making that information easier for people to actually use.
The future of business intelligence is not simply about having more dashboards. It is about creating a more natural interaction between people and their information.
Instead of navigating through multiple systems, users should increasingly be able to ask questions, explore context, investigate causes, and discover patterns across trusted data sources.
The important shift is from “Where is the data?” to “What can we understand from the data?”, and eventually, “What should we do with what we learned?”
The bigger picture
Data silos rarely disappear simply because an organization purchases another analytics tool. They require a combination of:
- Connected data
- Trusted definitions
- Accessible information
- Good governance
- Useful analytics
And, most importantly, a culture that encourages people to use information when making decisions.
Becoming data-driven is not about creating more reports. It is about reducing the distance between questions, insights, and action.
Your data may already be sitting in your databases, applications, spreadsheets, and cloud platforms. The opportunity is to stop letting that data sit there disconnected. Because the value of data is not in how much you store. It is in how effectively your business can use it.
What about your organization?
What is the biggest challenge your organization faces when turning existing data into actionable business insights? Is it data silos, data quality, accessibility, reporting delays, or simply knowing which questions to ask?
Talk to our data team and let’s find out together.